Visual Collaboration Technologies has sponsored this post.
The heart of America’s automotive industry circles Detroit. The city watches as the Big Three automakers make their cars and trucks in its leafy suburbs. In between the assembly plants, every office building and industrial park seems to exist to provide a service to the auto industry. To the North, in Troy, Mich., is Visual Collaboration Technologies, a maker of engineering simulation software that counts all the major auto manufacturers among its customers.
The company’s main product is VCollab, a solution created to make the results of engineering simulation more easily shared and understood. It was cofounded 20 years ago by Prasad Mandava, an India- educated structural engineer who, before founding Visual Collaboration Technologies Inc., managed the development of a finite element analysis (FEA) code for use on parallel processors and created digital mockups for the aerospace industry.
VCollab addresses the shortcomings in simulation post processors and in report creation/sharing such as the difficulty that the engineering analyst may have when trying to create and share simulation results and insights not only with other engineers, but also with those upstream and downstream of the engineering and manufacturing process.
Mandava saw the way engineers were laboriously trying to share their simulation results and create reports, even overlooking critical results. With VCollab, Mandava offers a better way.
And while simulation software has become more sophisticated and advanced, there has been little work by the simulation software industry to advance the ability of users to understand and present the results their software provides.
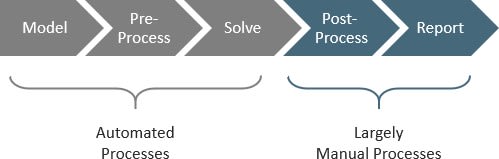
“While users have been able to leverage the power of simulation, the focus of both technology and industry have been primarily on the front end of CAE process automation,” noted Mandava. “Engineering tools have targeted modeling, preprocessing, and solving simulations. Investment in post- processing and in sharing and collaborating on simulation results and insights, however, has been largely ignored.”
The Traditional Way
The typical engineer will do a simulation and then study the results using the simulation software’s post processor. To share the results with others, who probably do not have a license of the simulation software, static images of the results are captured and pasted into a report. Microsoft’s PowerPoint, almost universally available, is often used due to its convenience.
Take a structural analysis, for example. An engineer doing an analysis will look for “hot spots,” or areas of high stresses. Screen captures will be taken of the hot spots. If the stresses are too high, the engineer may add a suggestion to the designer of the part that it requires some strengthening. He or she will add a sentence or two, citing values and/or adding explanation.
In this manner, the results are reviewed and a report is generated, often in PowerPoint, which is then shared and distributed as needed.
What’s Wrong with This Process?
So, what’s wrong with the time-honored method outlined above? Glad you asked….
You’ve Devolved
As a modern engineer, you have no doubt fully evolved in seeing your designs in 3D. Does it not bother you to be creating static 2D, low resolution images for your reports?
“Critical product design and development decisions will be made using low-fidelity, 2D information, which has been reduced in quality to fit available report sharing methods,” said Mandava. “Analysts must make educated guesses about which ‘snapshots’ of data to reduce to 2D for sharing. They are not able to show users of the information the original, high-fidelity 3D results.”
You’re Using the Wrong Tool
Virtually everyone has Microsoft Office software, so while it is indeed convenient, you know it was never meant to be used for engineering data. It can barely make graphs.
You Missed a Spot
A complicated part with many load cases should be studied carefully to find all the areas of potential failure. But what if a critical area is obscured, or simply missed?
Your Report Can’t Talk or Move
Sending a PowerPoint slide deck around may lead to questions as soon as people start looking at it. Like “Can you zoom in on that corner?” or “Can you show this moving so I can see how it deflects?” But you’ll not be there to explain.
You Hate Creating Reports
Cracking a tough case has to be the most exciting part of the job for cops. But the thrill of the chase is followed by the dreary task of writing the report. Similarly, so is the task of report creation after a simulation is created. You found the likely place of failure, you tell the designer where it is and… job done, right? Not so fast. There’s a lot of money on this contract. A paper trail proves our diligence, says the manager. The thicker the report, the better.
What’s Worse? Recreating Reports
“The process of creating these reports is not only painful and time-consuming—it must be repeated every time recipients such as design engineers request changes to simulation parameters,” said Mandava.
The time needed to create results reports—including multiple iterations—can chew into already contracted product timelines.
The VCollab Way
VCollab takes care of these problems, and more, according to Mandava. It starts by reading results from a simulation and creating a file of its own proprietary format (CAX) that is smaller and more compact.
You can output a 3D HTML file that is readable with any browser, a feature that immediately compensates for the inaccessibility of most result data. The 3D HTML file can be read by any and all you would like to give access to. You do not have to give them access to your post processor, train them in how to use it, or buy it for them.
Results files can be read from ANSYS, MSC Nastran, Abaqus, LS-DYNA, STAR-CCM+, Pro/MECHANICA, some Altair files, and others. However, COMSOL files don’t appear to be supported.
Images are 3D and in full resolution. You can zoom and pan, change perspective to your heart’s delight—and so can people you send the report to.
“VCollab provides high-fidelity, 3D simulation insights, because the quality of information is not reduced in the process of creating and sharing results,” say VCollab’s makers.
Automation of Post-Processing
Converting your 3D models into static, 2D images that are pasted into PowerPoint makes them less useful. VCollab claims to provide all the original 3D usefulness and it does so without having to acquire precious extra licenses of the simulation software.
Parts in assemblies can be animated in 3D, including exploding views. Deflections can be shown in exaggerated motion.
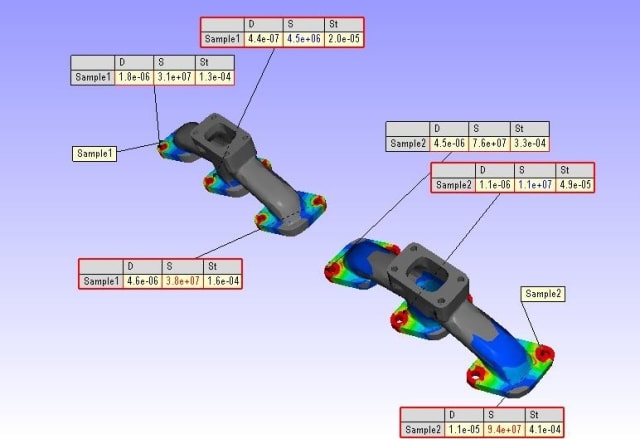
VCollab lets you compare the results of multiple designs in a single 3D view. You can even view results files created from different simulation software programs. You can also see the effects of separate load cases on a single design.
The makers of VCollab claim that users will be able to create simulation reports in minutes rather than hours while the detail and completeness of the information will increase substantially.
“Analysts spend substantially less time and create far superior simulation results and insights,” noted Mandava. “Design teams, OEMs and suppliers can collaborate on 3D actionable simulation insights which tell the full story, reducing product costs and timelines. The full value of simulation is recaptured.”
To learn more, check out the Visual Collaboration Technologies webinar on January 14th, 2020:
The Untapped Value in Simulation
Using simulation in product development has always promised great value. But how many companies have truly reaped the full value of this vision? There are fundamental challenges for both simulation expert analysts and engineers alike.
In this webinar, Chad Jackson will share insights on these challenges and what new technologies can be applied. This will be followed by a brief demo of the ways in which VCollab helps manufacturers realize all the benefits of simulation.